


BREYER e-Performance
The up-to-date information from your system

The BREYER e-Performance web application gives you a quick overview of the key figures and process values of your BREYER system.
We prepare your data from the shop floor via the IoT platform and display it in clear charts in your browser.
Production managers, operations managers, technicians and quality managers can view the most important current and historical key figures from their office.
Advantages
- Comparison of several plants
- Available worldwide
- Encrypted and therefore secure data connection according to ISO 27001 certified security standard
- Comparison to previous day, previous week, previous month
- Fast status information from the production plant to the office
- Modern graphics (speedometer displays, Gantt bar chart, etc.)
- Browser application, no software installation required
- Customizable
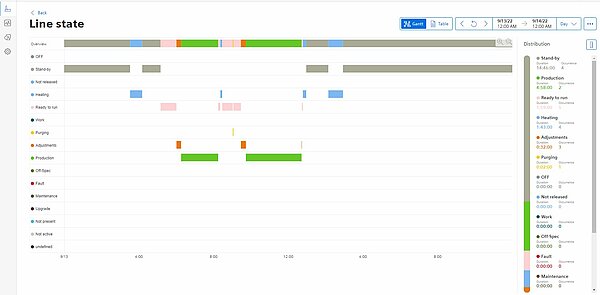
View e-Performance
Dashboards show you the output, the line status and the most important operating parameters such as energy consumption, line speed, pressure, temperature, etc. at a glance.
You can see the current values and daily trends and switch to historical times or zoom in on the time section of interest.